Software & Data Visualization


Creating interactive user interfaces that deliver a meaningful story using data and visual cues to bring it all to life.

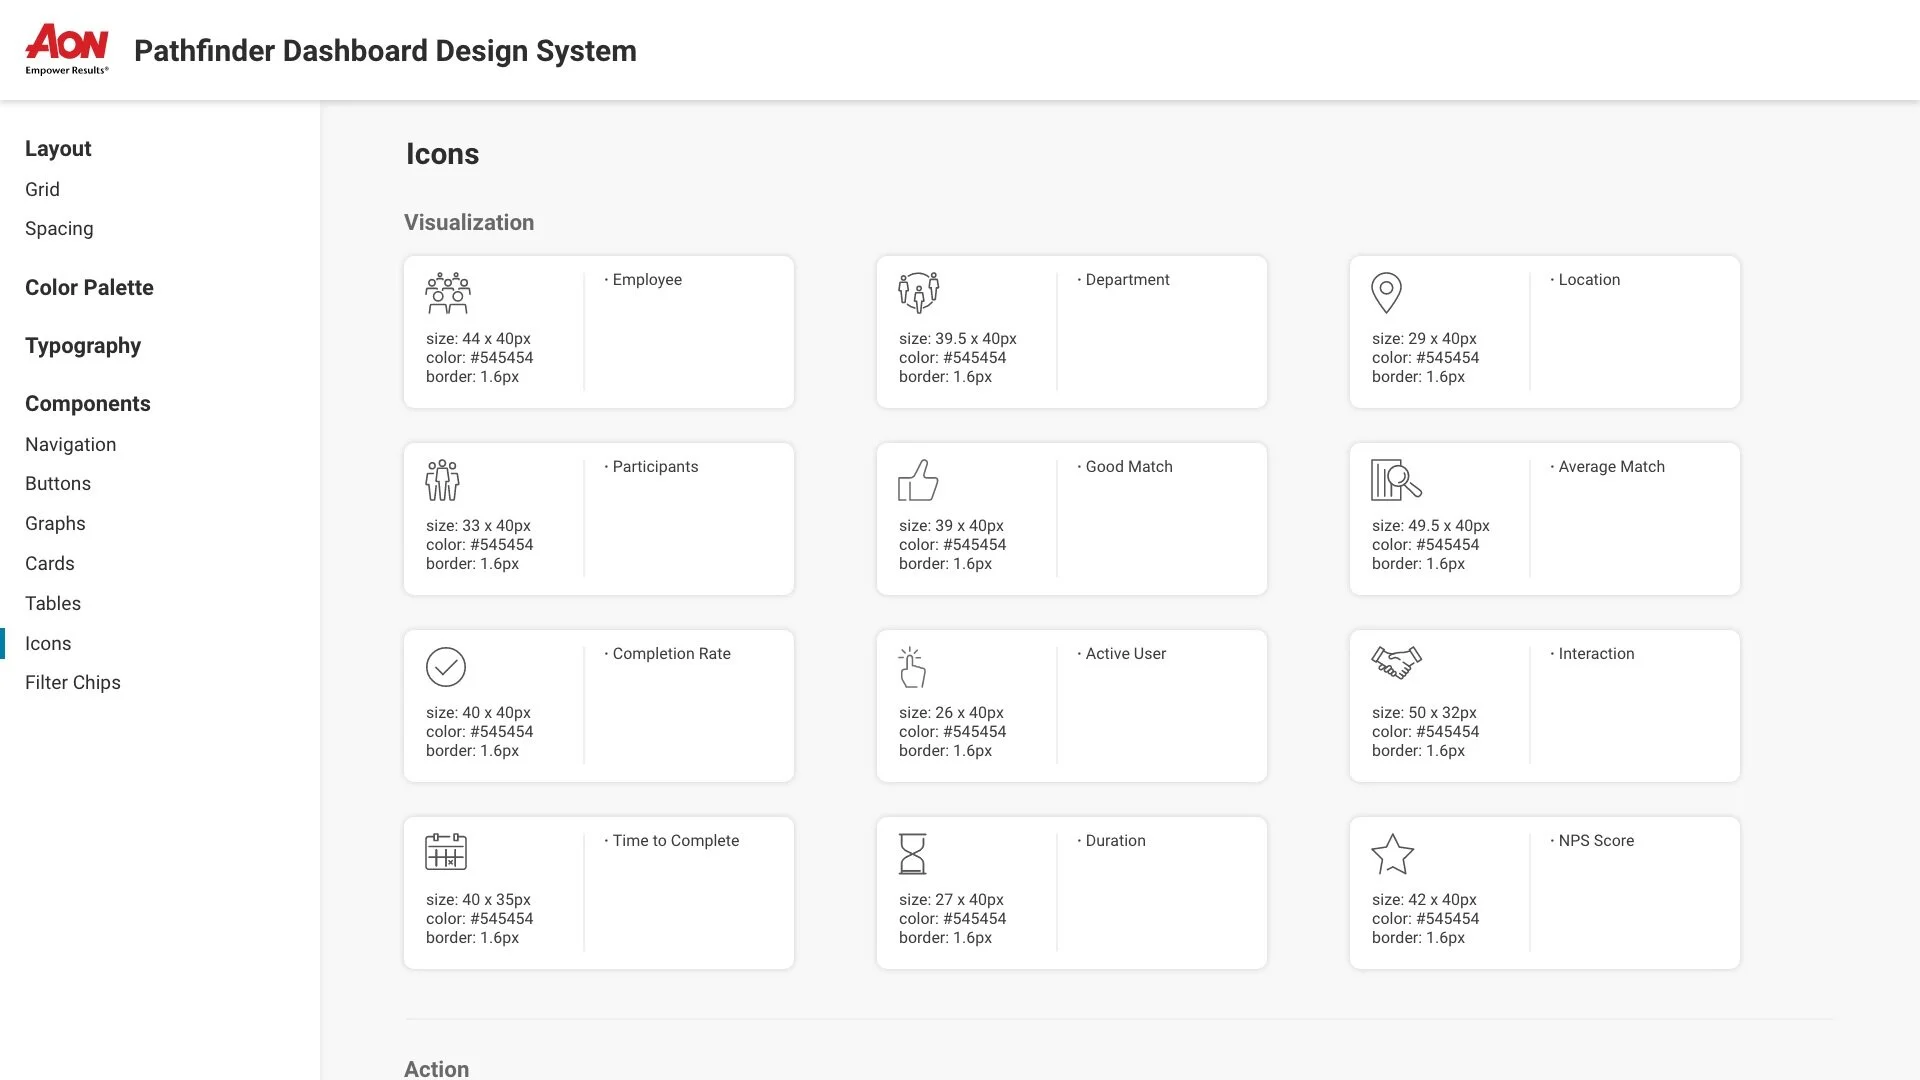
Screen Shot 2020-09-02 at 2.29.18 PM.png

Online Reports

Delivering feedback and tips based on data that drives individual and team change.

Filter+Chips+%E2%80%93+1.jpg

Design Systems

Documenting design patterns, making global collaboration effective, and products that are scaleable.

Overview – 6.png

Dashboarding

Pulling diverse datasets together to tell a meaningful story.

Artboard 1.png

Assessment Interfaces

Accessible and scientifically valid assessments that capture personality, cognitive, and other job-related skill levels.

Screen Shot 2020-09-02 at 2.42.56 PM.png

Informational Reporting

Commercially themed reports that deliver insights.

Screen Shot 2020-09-02 at 3.45.22 PM.png

Infographic

Shock value infographic to challenge buyer assumptions.

Next
Next

Web, Email, & Social